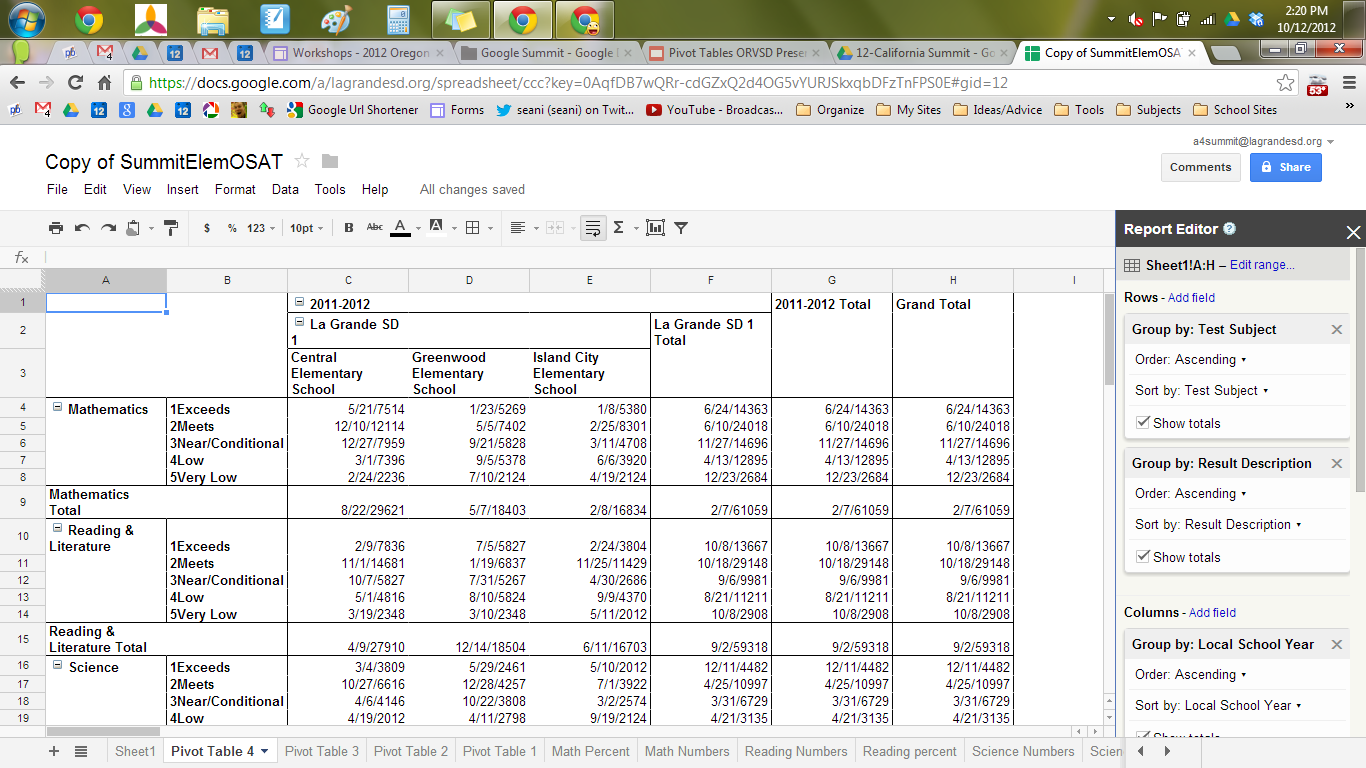
Pivot Tables basically summarize large amounts of data so that it is easier to understand the data. You can take a spreadsheet and manipulate/sort/combine the data in order to view it in a way that makes sense. See screenshot:


Google Summit 2012
There are lots of details I was unsure about. Lots to learn about pivot tables! It can certainly be frustrating and confusing at first, but the possibilities are endless. I was actually able to borrow a math unit template to possibly use it in my class to aggregate data from test scores from pre-tests and post-tests to view results in a more helpful, visual way.

Google Summit 2012
No comments:
Post a Comment
Note: Only a member of this blog may post a comment.